How to record GPS data with phyphox and plot them with WP GPX Maps

I plotted GPS data recorded by phyphox (Physical Phone Experiments) with WordPress plugin WP GPX Maps.

Phyphox is an open source software developed by RWTH Aachen University in Germany. Phyphox is available for free on Android and iOS.

It can record physical data such as 3-axis accelerometer data, sound data, position data (GPS), magnetic fields data and gyroscope rotation speed data.

This time, I recorded GPS data and plotted them on a map by using the WordPress plugin WP GPX Maps. Elevation and walking pace data at each position are also shown below the map.

A procedure to record GPS data with phyphox and plot them with WP GPX Maps

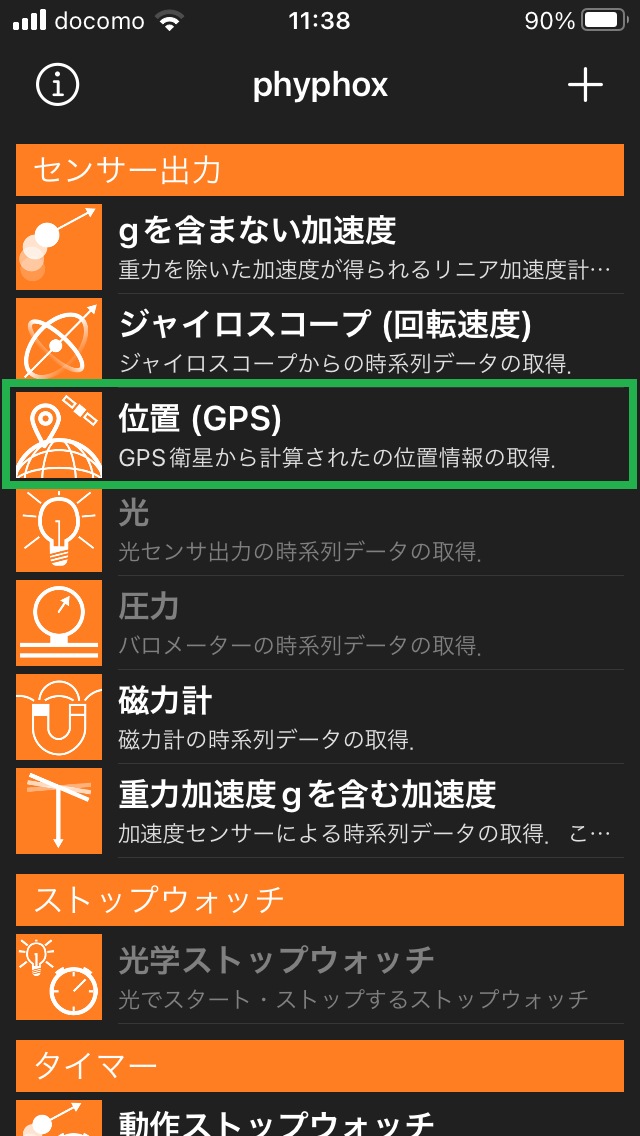
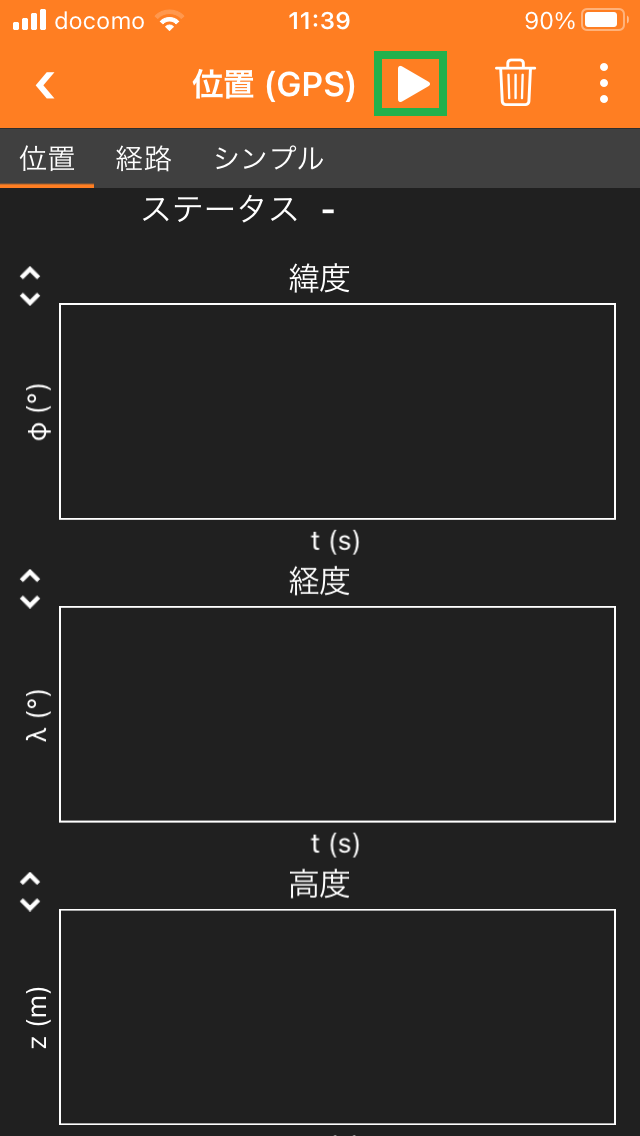
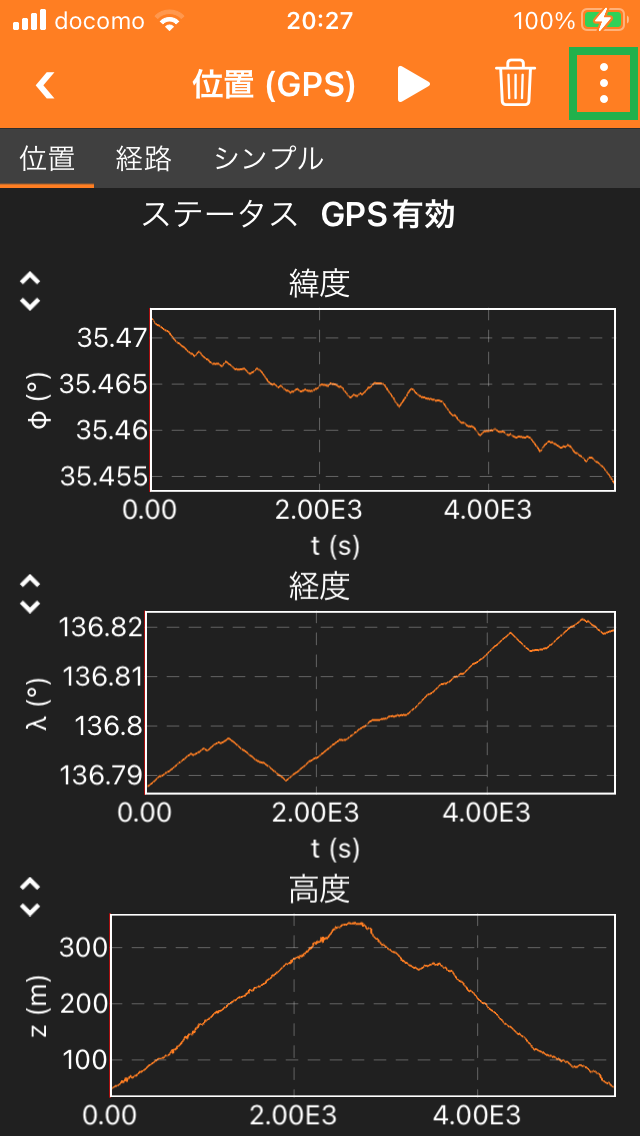
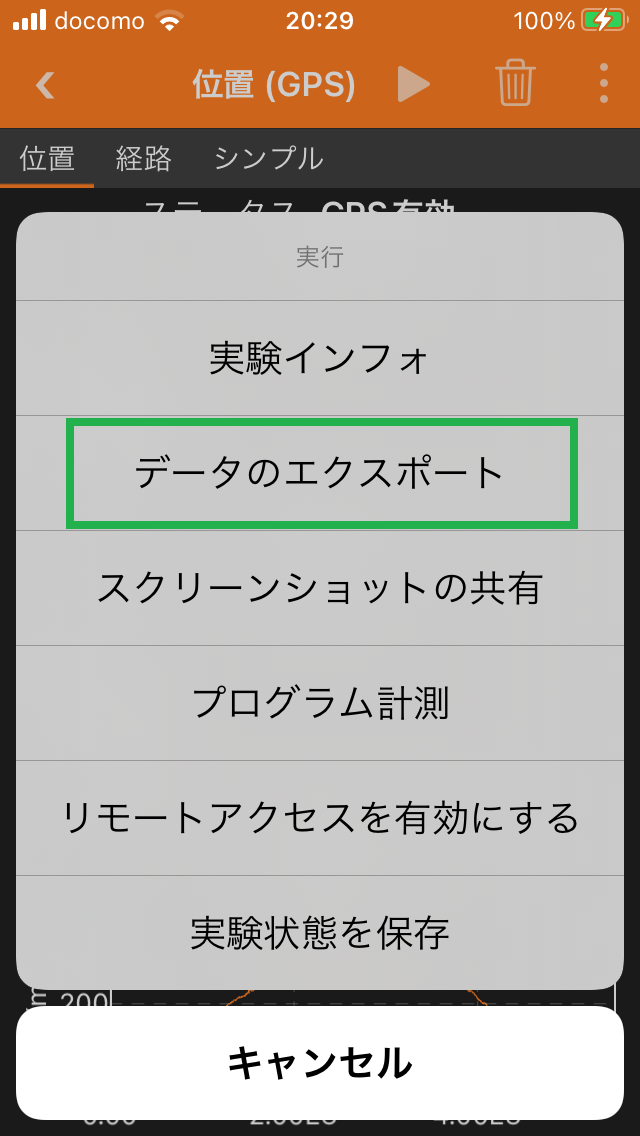
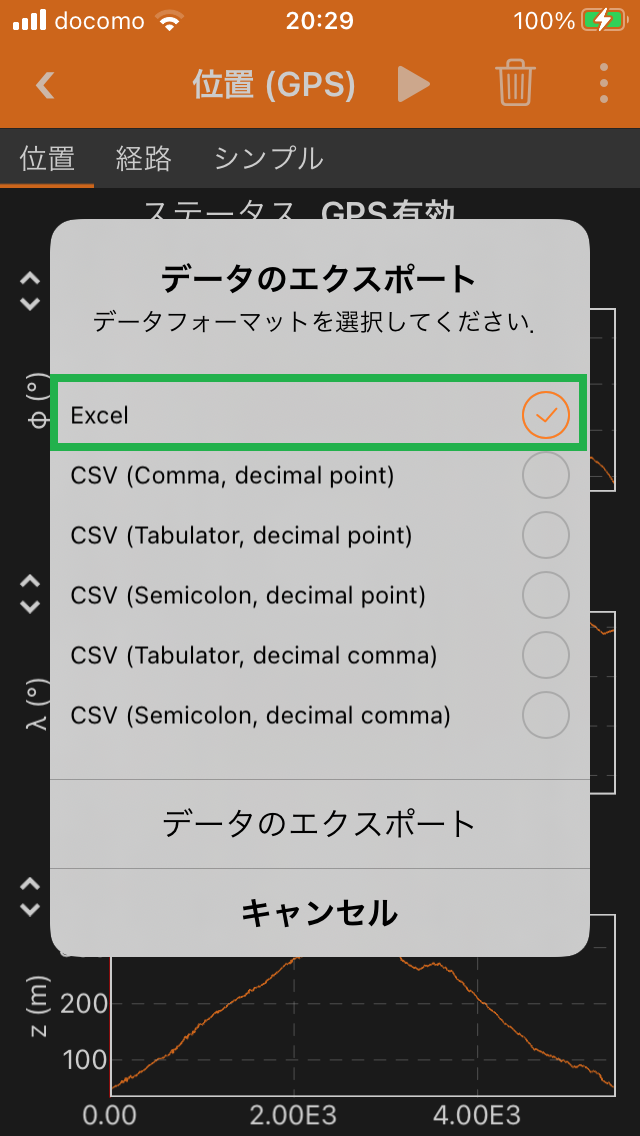
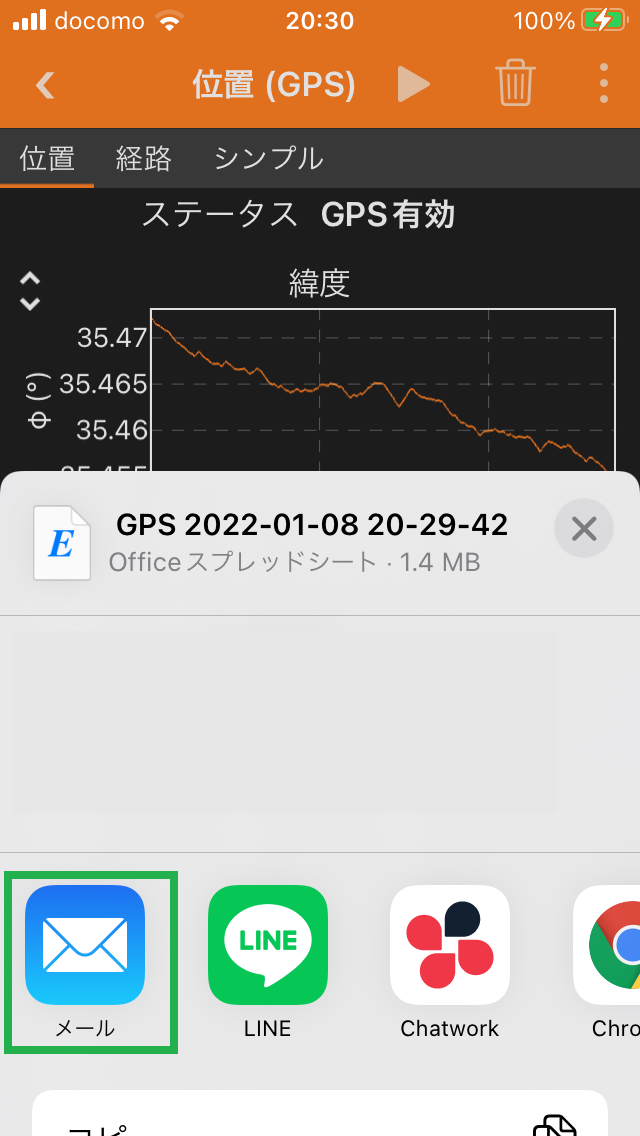
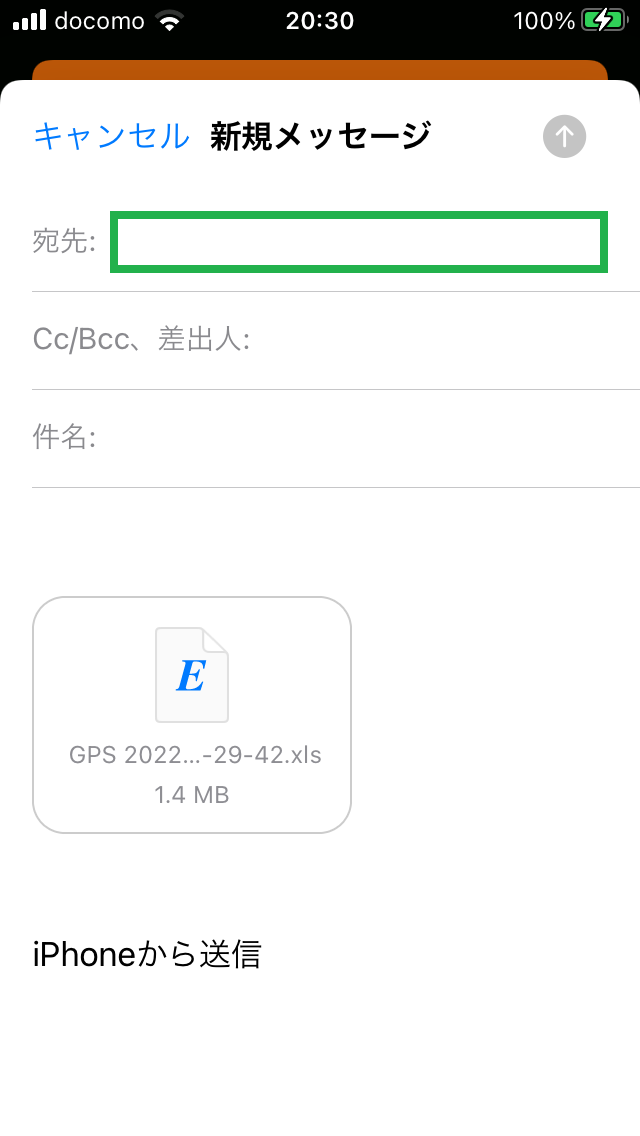
1. Click the buttons pointed with the green boxes in the figures 1.1. – 1.8. and send GPS data by attaching them to an email. (In this example, the data are saved in Excel file.)

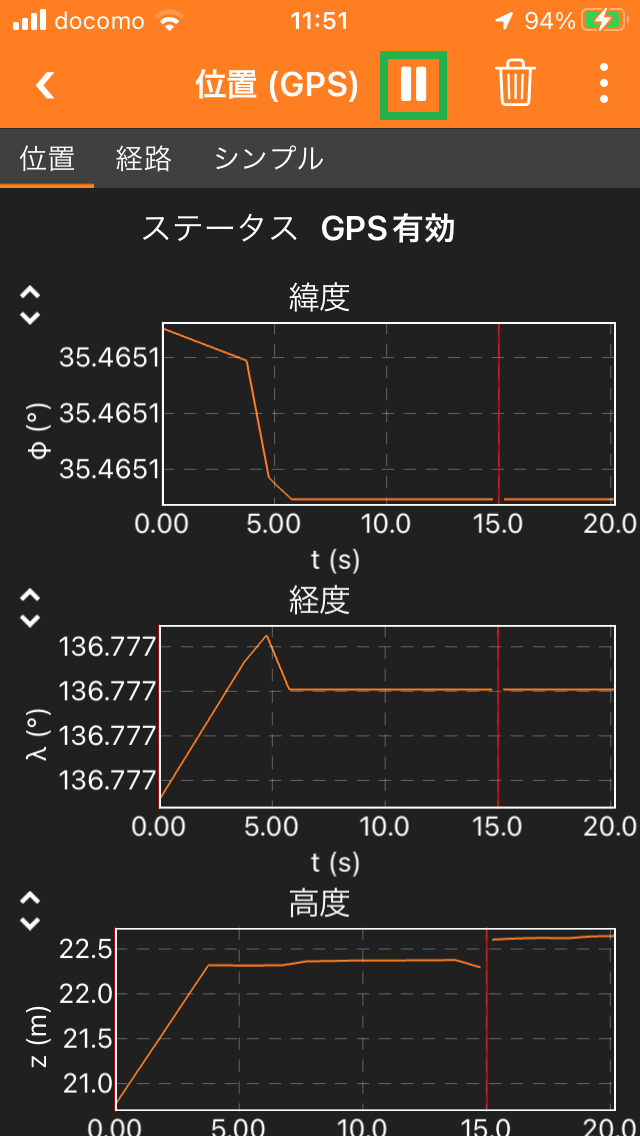
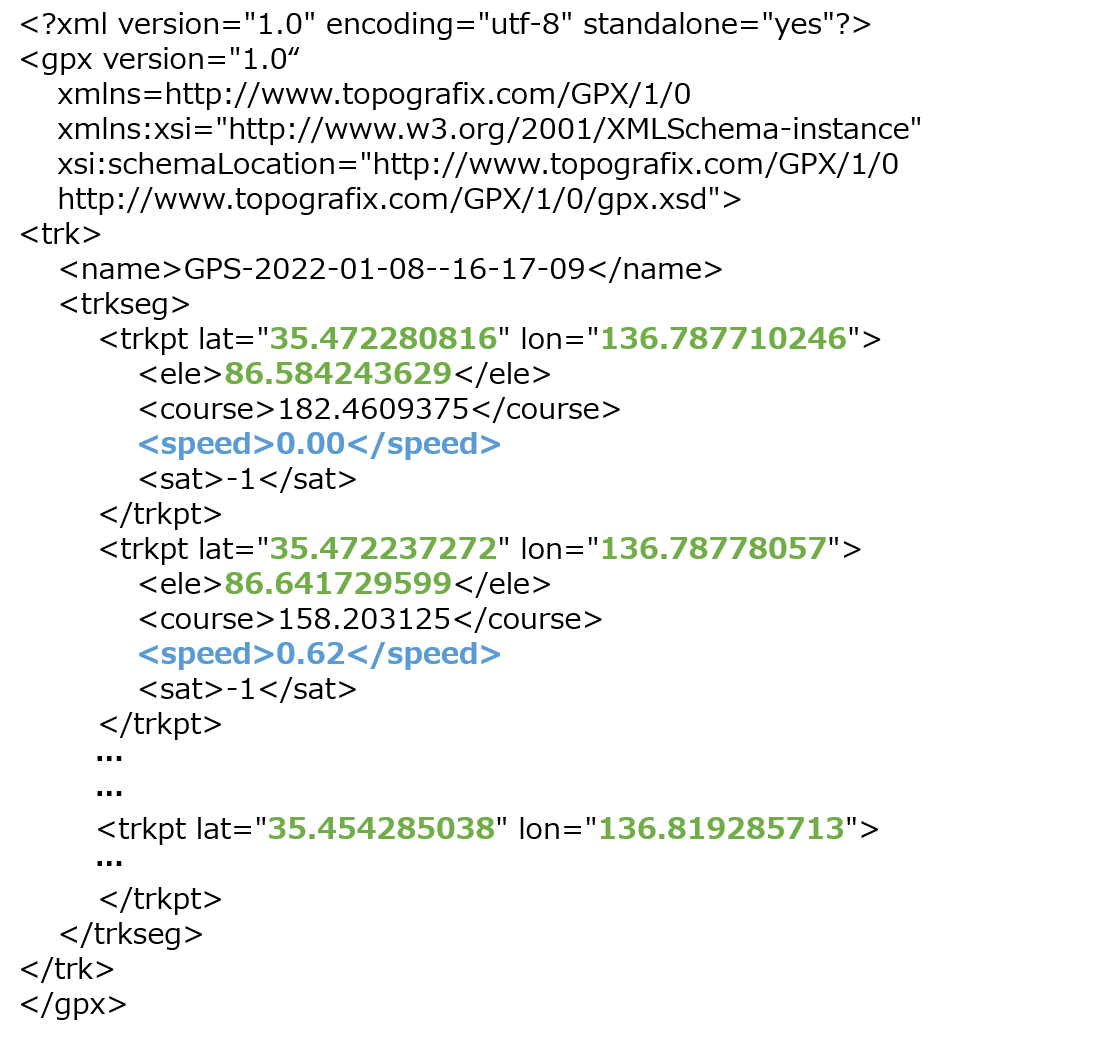
A recording starts when the button is pushed in figure 1.2. and it finishes when the button is pushed in figure 1.3.
2. Convert an Excel file to a GPX file with this blog page or other tools.

The figure below shows an example of a GPX file, which is an XML format file with a trkseg tag inside the trk tag. There are a number of trkpt tags inside the trkseg tag. The attribute lat of the trkpt tag specifies the latitude, and lon specifies the longitude.

The elevation is specified by the ele tag inside the trkpt tag, and the speed tag specifies the pace at which it passed the location. Although not specified in this example, the time tag inside the trkpt tag can also be used to specify the time when the location was passed.

This link is for GPX 1.0, not for the latest format, but it summarizes the basic features of GPX format.
An example of a GPX file
3. Display GPS data with WP GPX Maps plugin
3.1. Select “Plugins -> Add New” from the WordPress dashboard.

3.2. Search for WP GPX Maps to install and activate it. The figure 3.2. on the right shows the image after WP GPX Maps activation.

3.3. The figure 3.3. on the right shows a status that WP GPX Maps has been activated in the dashboard.

3.4. Select “Settings -> WP GPX Maps” from the dashboard.

3.5. On the Tracks tab, select the GPX file you have saved on your PC and upload it on your Web server. The shortcode will be generated.

3.6. Click the Settings tab and check the Speed checkbox in the Chart column to display the pace on the graph below the map. You can also change the color of the graph.

3.7. The figure 3.7. on the right shows a shortcode widget in Elementor. Insert this widget into a page or post with Elementor (if you use Elementor).

3.8. Copy the shortcode generated in 3.5. from the dashboard and paste it on the shortcode widget.

Leave a Reply

Your email address will not be published. Required fields are marked *

CAPTCHA