I wrote the procedure to read Google Sheets from Google Charts on this page before. Anyone can read the Sheet data with this method.
Google Charts document describes the method to read Google Sheets with authentication on this page. I tested the method with OAuth this time.
I tested the method, “Example: Using OAuth to access /gviz/tq”.
First, I prepared “OAuth client ID” by following the procedure described below.
1. From the developer console, create a new OAuth client ID.
2. Choose Web application as your application type.
3. Pick any name; it is for your information only.
4. Add the name of your domain (and any test domains) as Authorized JavaScript Origins.
5. Leave Authorized redirect URIs blank.
Next, I wrote the following JavaScript by referring to the sample codes described here. The code plotted the graph with Google Sheets data which allow the read access to the limited users.
# In the following JavaScript, we need to use valid clientId and tpUrl that is suitable for our environment.
<button id="authorize-button" style="visibility: hidden">Authorize</button>
<script type="text/javascript" src="https://www.gstatic.com/charts/loader.js"></script>
<script type="text/javascript">
google.charts.load('current', {packages:['corechart']});

const clientId = '111111111111-0123456789abcdefghij01234klmnopq.apps.googleusercontent.com';
const scopes = 'https://www.googleapis.com/auth/spreadsheets';


function init() {
    gapi.auth.authorize(
        {client_id: clientId, scope: scopes, immediate: true},
        handleAuthResult);
}


function handleAuthResult(authResult) {
    const authorizeButton = document.getElementById('authorize-button');
    if (authResult && !authResult.error) {
        authorizeButton.style.visibility = 'hidden';
        makeApiCall();
    } else {
        authorizeButton.style.visibility = '';
        authorizeButton.onclick = handleAuthClick;
    }
}


function handleAuthClick(event) {
    gapi.auth.authorize(
        {client_id: clientId, scope: scopes, immediate: false},
        handleAuthResult);
    return false;
}


function makeApiCall() {
    const tqUrl = 'https://docs.google.com/spreadsheets/d/1ZBELqu5CuNJJJBe6Ho9wJFyW4bv2F-VDKrz_LCwZRi4/gviz/tq'
        + '?access_token=' + encodeURIComponent(gapi.auth.getToken().access_token);
    const query = new google.visualization.Query(tqUrl);
    query.send(drawChart);
}

const skip_length = 1;
const time_interval = 0.01;

function drawChart(response) {
    const data = response.getDataTable();
    const numRows = data.getNumberOfRows();
    const numThinnedRows = Math.floor(numRows / skip_length);
    const remainder = numRows % skip_length;

    for (let rowIndex = 0; rowIndex < numThinnedRows; rowIndex++) {
        data.removeRows(rowIndex, skip_length - 1);
    }

    if (remainder != 0) {
        data.removeRows(numThinnedRows, remainder);
    }

    // data thinning
    const options = {title: 'phyphox 3-axis acceleration sensor data (after data thinning)',
                     hAxis: {title: 'time[s]'},
                     vAxis: {title: 'acceleration [m/s^2]'}};
    const chart = new google.visualization.LineChart(document.getElementById('after_data_thinning'));
    chart.draw(data, options);
    // ...
}

</script>
<script src="https://apis.google.com/js/auth.js?onload=init"></script>
I prepared Web Application whose public status is “Test” on OAuth page in Google Cloud Platform. I registered a test user on this Web Application. I also specified the domain name (leafwindow.com) which refers to the Google Sheets.
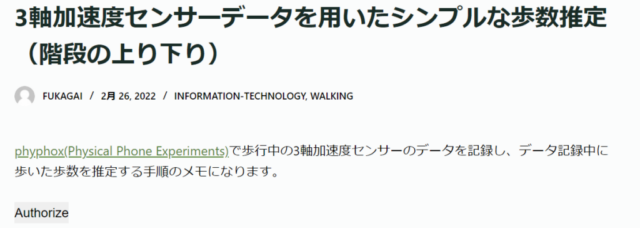
When I wrote the JavaScript on my web page, the “Authorize” button was displayed.
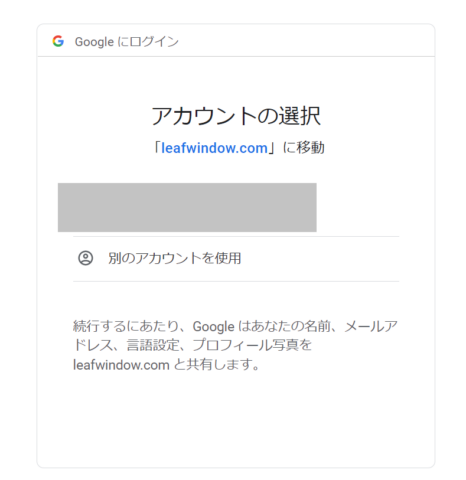
When I clicked the “Authorize” button with Chrome, the window below was displayed.
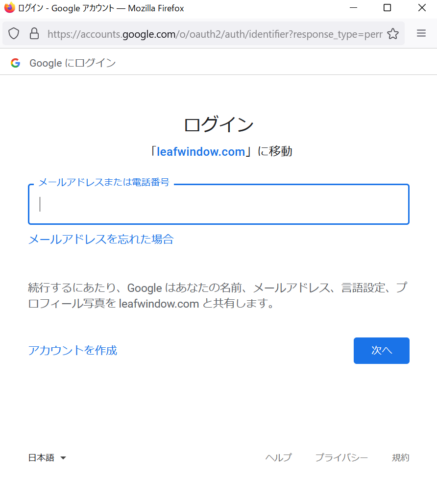
The following window was displayed when I clicked the “Authorize” button with Firefox.
Google Charts graphs were displayed when I entered the email address of the registered test user. (We would be required to enter our valid passwords if we are not using Chrome with the registered user’s account.)
The graph would be displayed at the place where we write the following code (in case of the above JavaScript).
<div id="after_data_thinning" style="width: 100%; height: 500px;"></div>
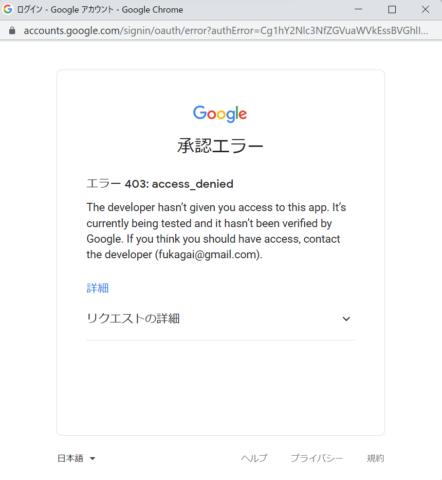
The window below was displayed when I entered the unregistered email address.


