
I recorded 3-axis accelerometer data with phyphox(Physical Phone Experiments) and plotted them with Google Charts.
1. I recorded 3-axis acceleration sensor data with phyphox by pushing green buttons shown in the following pictures. I specified the receiver’s email address (my email address) in the last picture to send recorded data.
I started recording by pushing ▶ button in the second picture and stop recording by pushing the stop button in the third picture. I recorded 3-axis acceleration sensor data with gravitational acceleration.
I measured walking motion with 3-axis acceleration sensor by bringing smartphones.


2. I uploaded the recorded data on Google Sheets. Google Charts can read and plot the uploaded data.
3. The procedure to upload recorded data on Google Sheets and plot them with Google Charts
3.1. I logged in my Google account with Web browser and opened Google Sheets.
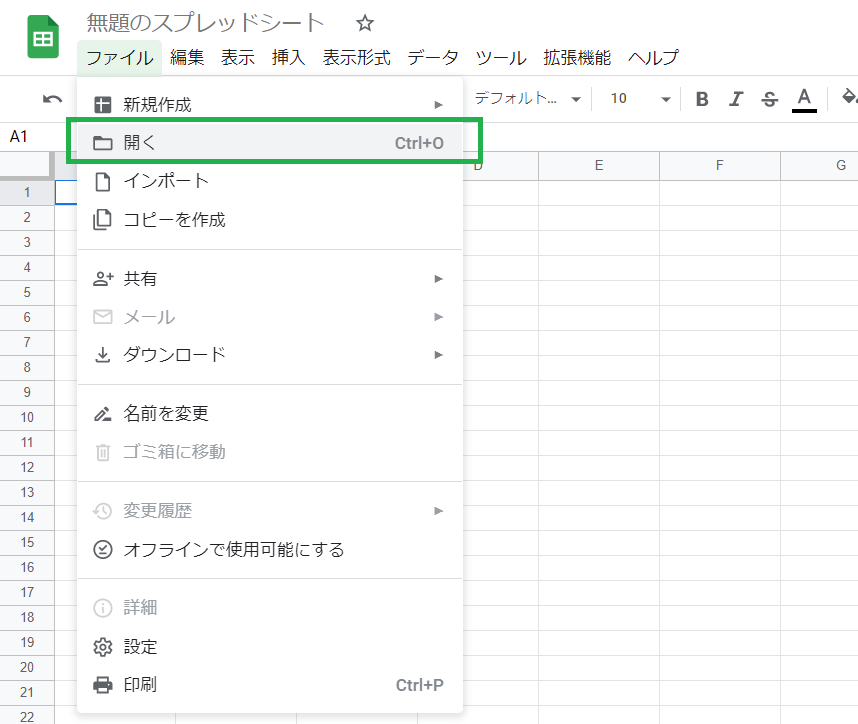
3.2. I opened an Excel file exported from phyphox with Google Sheets.
3.2.1. I selected “file open”.
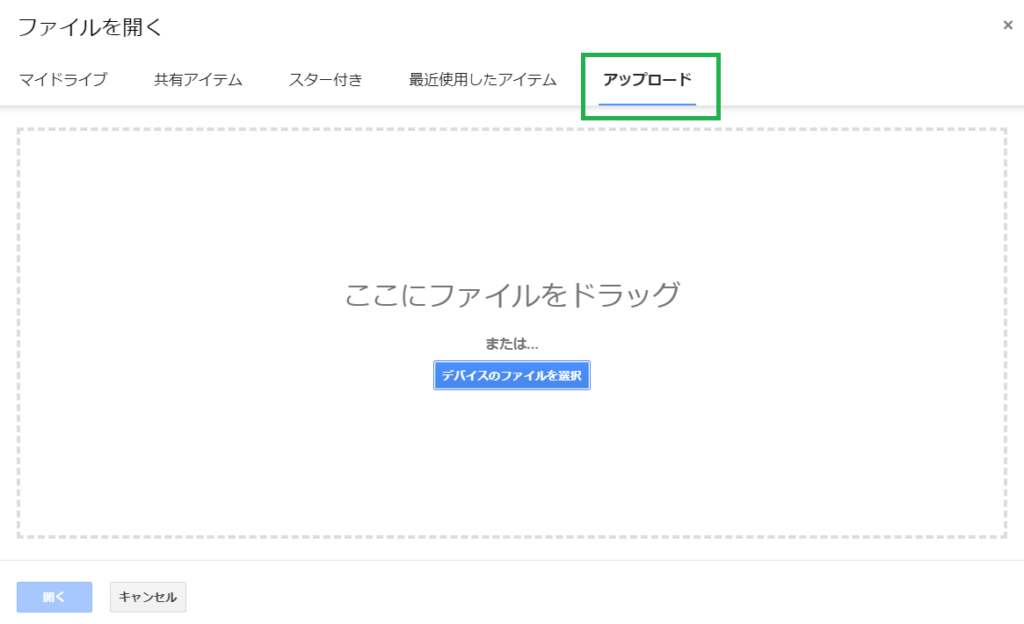
3.2.2. I selected “upload tab”.
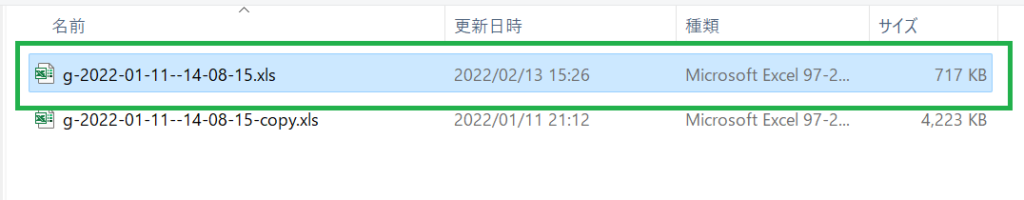
3.2.3. I selected an Excel file exported from phyphox.
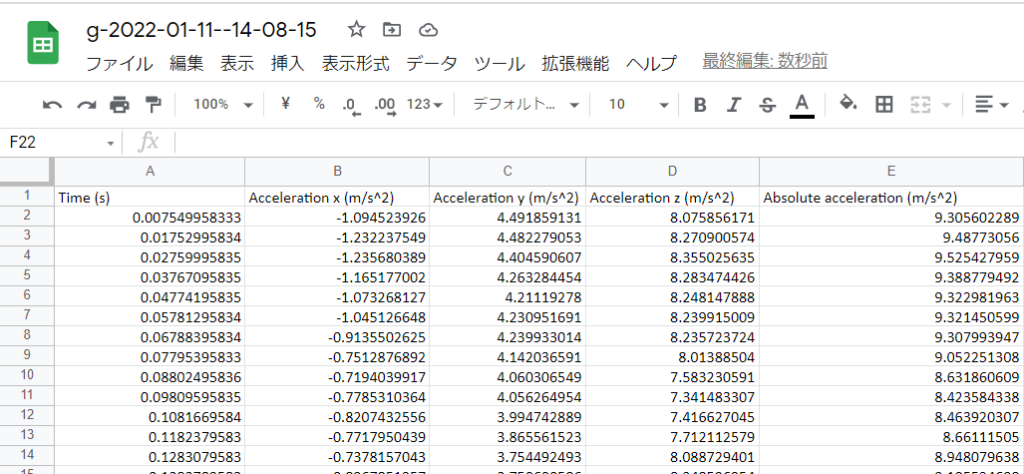
3.2.4. The data recorded with phyphox were displayed.
3.3. I made the uploaded data readable for any users.
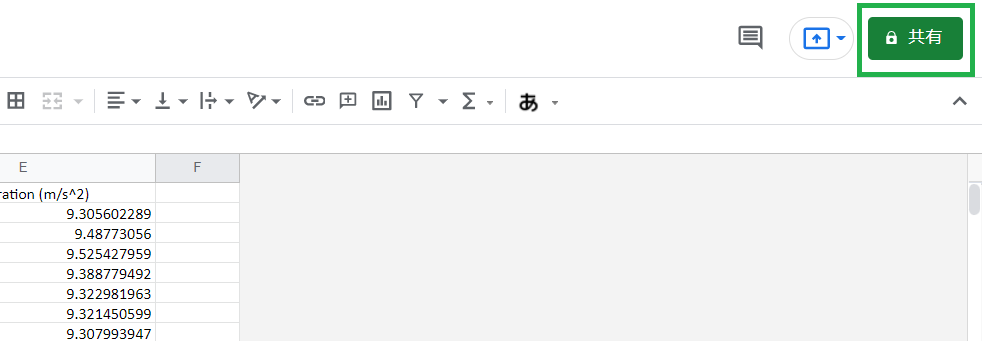
3.3.1. I clicked the button in the green box.
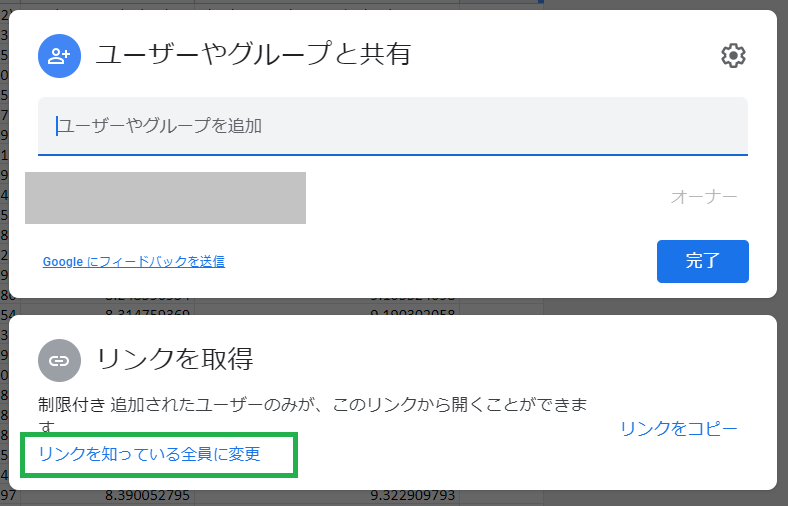
3.3.2. I clicked the link in the green box.
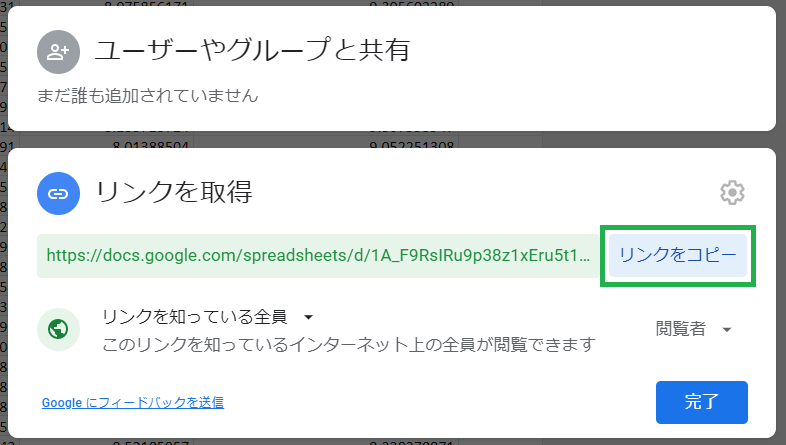
3.3.3. I clicked the button in the green box and copied the URL.
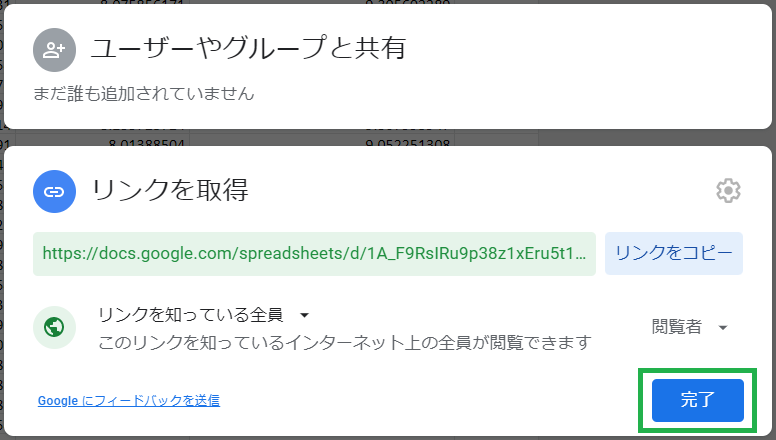
3.3.4. I clicked the button in the green box.
3.4. I used JavaScript with WordPress posts. This post describes one of the methods to use JavaScript with WordPress pages and posts.
I used following JavaScript on this post. The URL given to google.visualization.Query is the one copied in 3.3.3.
<script type="text/javascript" src="https://www.gstatic.com/charts/loader.js"></script>
<script type="text/javascript">

google.charts.load('current', {packages:['corechart']});
google.charts.setOnLoadCallback(Spreadsheet);

function Spreadsheet() {
  var query = new google.visualization.Query('https://docs.google.com/spreadsheets/d/1A_F9RsIRu9p38z1xEru5t10_MlN8TN1hx0Fv5yaIBAI/edit?usp=sharing');
  query.send(drawChart);
}

function drawChart(response) {
  const data = response.getDataTable();
  const options = {title: 'phyphox 3-axis acceleration sensor data',
                             hAxis : {title: 'time[s]'},
                             vAxis : {title: 'acceleration [m/s^2]'}
                             };
  const chart = new google.visualization.LineChart(document.getElementById('phyphox_g_line_chart'));
  chart.draw(data, options);
}

</script>
The graph below will be displayed with this JavaScript.